This documentation is a work-in-progress, so apologies for incompleteness, incoherence, errors, omissions, etc...
First off, I want to make it absolutely clear that there's no agenda here about how awards should reflect popularity, or that awards that don't meet someone's personal perception of what is "popular" are bad/fixed/etc, or any similar nonsense. (Although I am more than happy to point out cases where certain individuals or groups claimed to represent popular opinion, but whose idea of which books are popular don't seem to be backed up by the statistics.)
Anyway, these charts are an attempt to get an impression of what SF&F books - by which I broadly mean novels, see below for more details - might be the most widely read amongst (present-day) book readers, and which "classics" of the past have maintained their mindshare into the modern day. Books which have been nominated for awards are the sample set being used here.
Now, I definitely don't think any awards are flawless, but taken as a whole they do give an interesting perspective on the history of the field. Perhaps in some cases they are no more an indicator of quality than pop charts or box office figures, but both of those have led to interesting cultural analyses.
Nevertheless, a selection of the finalists for some of the highest profile and/or longest running awards seems a reasonable set of books to use. Another option might be the books that have been reviewed by long running magazines such as Locus or the BSFA's Vector, both of which have their reviews indexed by ISFDB - for example, recent issues here and here. Whilst I may well look at charts based on those books in the future, for now, award finalists seem to be a reasonable starting point.
I've had the idea to build something like these charts for a while, specific inspirations include the following:
The Internet Speculative Fiction Database is a - IMHO massively underrecognized - website with lots of data about SF&F authors and their books/stories. Data on the site is contributed by users, but - unlike Wikipedia or Goodreads - all changes have to go through a moderation step where an administrator of the site approves or rejects the change. My experience in building these charts based on data from both ISFDB and Goodreads - and prior experience using Wikipedia data - is that ISFDB is more reliable than others. (NB: I have contributed data to all three of these sites, so I don't have a particular dog in this fight.)
Have a look at the Wikipedia page if you're unfamiliar with this website/app.
There are many - some will say, too many - awards for written science fiction, fantasy and horror. Rather than attempt to describe them all, please refer to:
This section is here in part because some of the terminology comes from the Goodreads site, yet Goodreads itself is sometimes inconsistent or vague about the meaning of terms it uses. The below are the interpretations used for processing the data to generate these charts.
The term "finalists" is used throughout these charts, but depending on the award in question, "nominees" or "shortlist/shortlisted works" may be the more specific term in use. Most (all?) awards have a stage prior to declaring the winner where between 3 and 10 works are declared as finalists, nominees or the shortlist, and these are what are displayed in these charts.
The hope is that this small set of finalists provides a more useful view on the notable books of the year than merely focussing on the winner.
Rating a book is when a Goodreads user gives it a quality rating from one to five stars. This is different from reviewing a book, which is posting a text review - there are unsurprisingly far more ratings than reviews, given the levels of effort involved.
In the context of these charts, we have no interest whatsoever in the rating values, whether individual or aggregated as an average. Rather, it is the number of times a work has been rated that is being measured. This is presumed to be a reasonable, if imperfect, proxy for the number of Goodreads who have read a book. Reasons why this might be an imperfect metric include:
Theoretically a better metric for measuring readership is when a Goodreads user "shelves" the book as "Read", as opposed to the other states of "To Read"/"To Be Read" or "Currently Reading". There are two issues with this:
"Publications" (aka pubs) is a term used in ISFDB, whereas Goodreads uses "editions". These can be broadly treated the same, although I think there are differences.
Any given book (aka work aka title) will likely be available in multiple publications aka editions. These could be the type of media e.g. paperback vs hardback vs ebook vs audiobook, but also translations into other languages, reprints (possibly with new covers, or introductions, etc).
ISFDB records multiple - ideally all - publications of a work, and the code that generates the charts needs to pick one that has an ISBN to query the Goodreads API for the ratings count. We could get incorrect/misleading data back from that API if one of the following happens:
All the data about awards, categories, winners and finalists/nominees/ shortlists comes from ISFDB, specifically the database dumps they kindly make available each week.
From the database, ISBNs for editions of the award winning/nominated works are obtained. (This isn't quite as trivial as it might seem, see the details section below.) The ISBNs are then used in a query to the Goodreads API to get the counts of the number of people who rated the book.
All the collected data is then used to build SVG charts, with JavaScript used to provide some basic interactivity. Some basic HTML web-pages are also created.
A local MariaDB instance runs the ISFDB database, and is queried by Python scripts for award data. These scripts also query the Goodreads API for the stats, which are incorporated into the data in memory. The scripts output SVG and HTML in a fairly crude way, and the resultant files are copied to a public webserver.
The scripts are initiated manually, but then run without intervention, taking around a minute if all Goodreads API is in a local cache. There are a few configuration files to bodge over inconsistencies or weirdnesses in the data e.g. books which have ISBNs in Goodreads that aren't known to ISFDB, nominees that aren't books (e.g. Wheel of Time in the 2014 Hugos).
All the SVG charts are complete in themselves (i.e. no external resources such as JavaScript or CSS files) and so can be saved and used in other applications that support SVG, albeit without interactive functionality in applications (e.g. Inkscape or Powerpoint ) that don't support the required technologies.
Notable pain-points whilst developing and testing included:
First off, the code that generates these charts is utterly dependent on the data for awards being in ISFDB, so if the award you'd like to see isn't there, it won't be here.
Short fiction - by which I mean the individual novelettes, short stories, flash fiction etc, rather than the publications which might contain them - is probably a non-starter, primarily as they don't have individual ISBNs, which are necessary for the API queries to Goodreads. Even if we were able to map an individual story to a containing publication - which should be possible with the ISFDB database - we'd then need to determine which of potentially many publications that included the story (example) should be used to get a meaningful count? It's also worth noting that Goodreads has had an uncomfortable relationship with magazines.
Novellas might be easier to deal with, given that recent novella finalists have been available as standalone publications with ISBNs. However a glance at the Wikipedia page indicates until fairly recently most were in the pages of magazines, and thus we are back to the same problems as for shorter fiction. Perhaps this might be solvable with some manual overrides, but as I'm not a reader of shorter fiction, this isn't something I'm personally interested in looking at. Any volunteers?
(For what it's worth, I have included a chart for the Locus Best Anthology and Best Collection awards, although those fit more comfortably into the world of book-like things with ISBNs. EDIT: These two charts have been temporarily removed as the generation process was causing confusion for any novels that might have been included within a collection.)
I've avoided the Tiptree Award for the time being, because the data seems a bit messy: lots of the finalists are shorter fiction with the issues mentioned previously, or not even written fiction at all. Additionally there are several "meta records" in the ISFDB for it that I suspect shouldn't even be there. I'll probably come back and take another look at it at some point, but I'm not considering it a priority right now.
Quite possibly they are completely bogus and shouldn't be paid any attention - I'm not going to try to convince you otherwise if that's what you think. This comment by Camestros Felapton at File 770 (which I have shamelessly stolen without asking permission to reproduce here) is similar to my own feelings about this data versus potential alternatives:
"...it is more a case of any data source in a storm: there’s no really good source of data on what is being read that is readily available. Bestseller lists are gamed and rely to much on physical book stores, Amazon is opaque about its methods and publishers are secretive. Goodreads has issues (of which said Amazon is one) but it is dominated by people who read lots of books."
There are some published facts and prior research that may give a better idea about the usefulness of these stata though:
(If anyone knows of any other relevant studies or posts, I'd love to hear about them!)
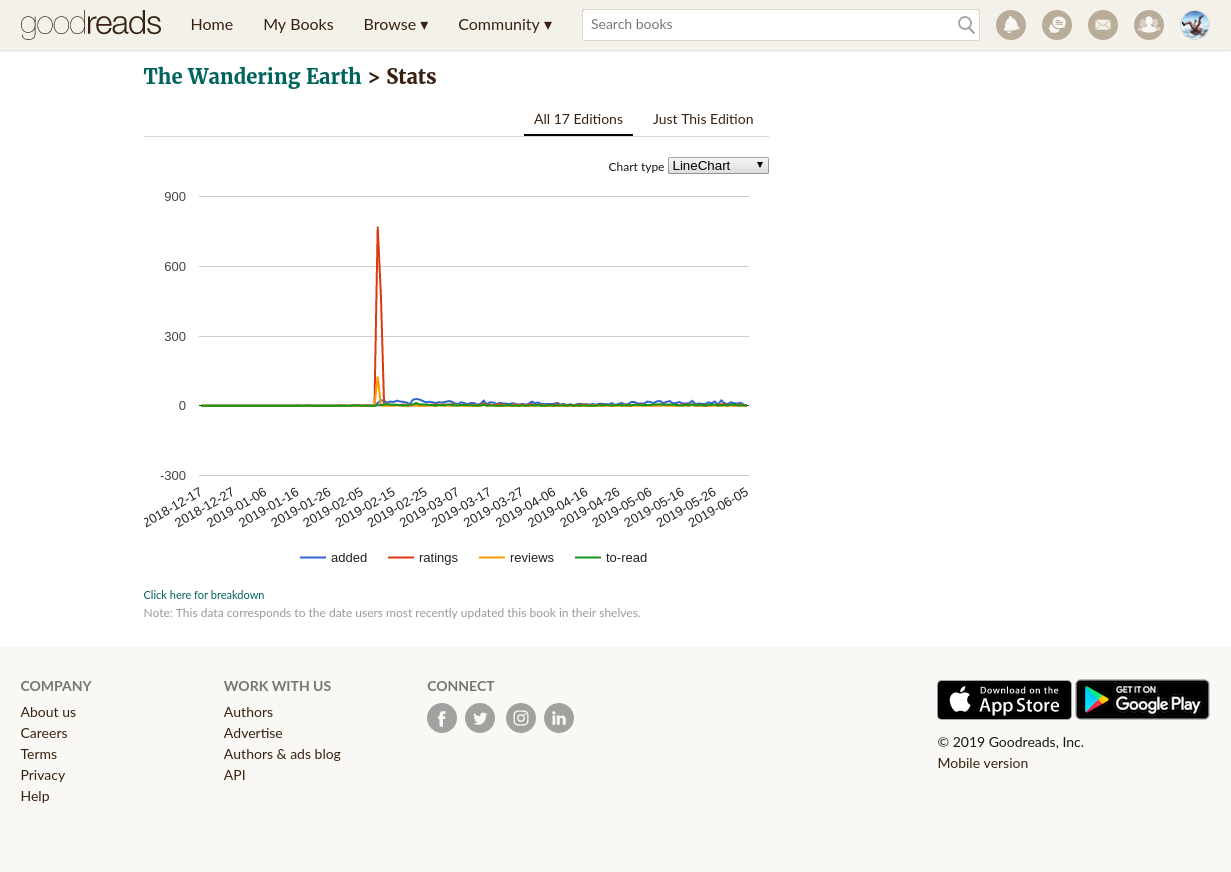
It's also worth noting that Goodreads stats aren't immune from being gamed - for example, look at this very very curious ratings spike about which one can only ponder the motivation... (Here's a screengrab in case you're reading this after the data is no longer visible on Goodreads.)
Short answer: No(t yet).
Pedantic, unhelpful answer: Yes, the ISFDB downloads are here, and the documentation for the Goodreads API is here, so go and knock yourself out!
Proper answer: there are Terms of Service associated with the Goodreads API that make me leery of giving out the raw data - I'm looking specifically at items 2, 3 and 6 on that page. Of course, putting these charts online is arguably "redistribution", but hopefully this use is considered reasonable, especially when you consider that similar data - presumably manually gathered - has previously been published online - see links near the top of this page. I do intend to make the code that generates these charts available though - most (possibly even all) of the code to get the data out of ISFDB is on GitHub, and I'll upload the code to query Goodreads and output the charts up once I've tidied it up sufficient that I think it's fit for human consumption.